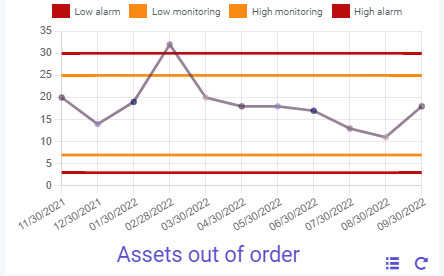
This tab is used to display the history of values stored for the indicator:
- by selecting, if desired, display start and end dates,
- by entering, if necessary, the settings (Entity, User),
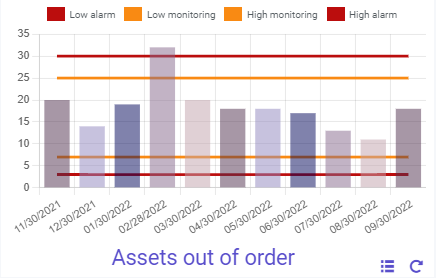
- by selecting a display type: List, Histogram or Line.
List
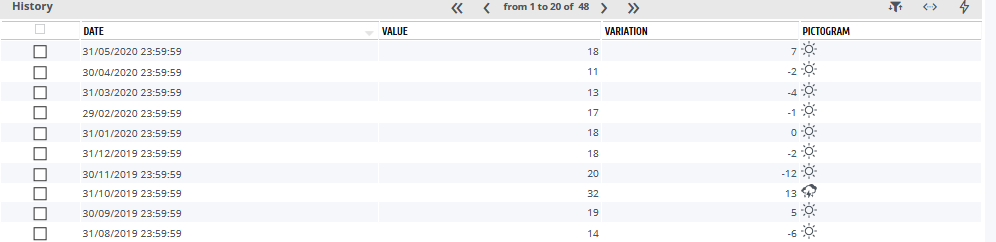
For each new value stored, the corresponding icon is displayed, together with the variation relative to the previous value.
Histogram
A key is shown beneath the graph.
Line
A key is shown beneath the graph.